Pricing Analysis In order to provide more insight into TransDigm’s acquisition strategy, we attempted to quantify how a company’s pricing for military spare parts changes after TransDigm acquires the company. Using contract data from Haystack Gold and a sample of 2,156 parts (as well as a subset that eliminated outliers), we calculated annualized price increases […]

Pricing Analysis
In order to provide more insight into TransDigm’s acquisition strategy, we attempted to quantify how a company’s pricing for military spare parts changes after TransDigm acquires the company. Using contract data from Haystack Gold and a sample of 2,156 parts (as well as a subset that eliminated outliers), we calculated annualized price increases in the years leading up to an acquisition by TransDigm as well as annualized price increases in the time post-acquisition. In our sample, we found evidence that prices tend to increase at a higher rate after TransDigm makes an acquisition.
We calculated average price increases in a few different ways, all of which told a similar story with varying magnitudes. The contract-size-weighted averages, which place a higher weight on larger contracts, suggest that year-over-year price increases are three times as large post-acquisition as they were pre-acquisition. We selected twenty different TransDigm owned subsidiaries for our data analysis. We selected these specific subsidiaries because each company’s CAGE code did not change before or after the acquisition, which made it easier to track changes in prices.
Haystack Gold had contract information on thousands of parts spanning several decades for these subsidiaries. To focus our analysis on the pre- and post-acquisition behavior, we reduced this dataset down to a sample size of 2,156 (and a smaller subset of 1,774 parts to eliminate outliers). The results are summarized in the following table, and our methodology is discussed in greater detail below.
In-depth Explanation of Our Analysis
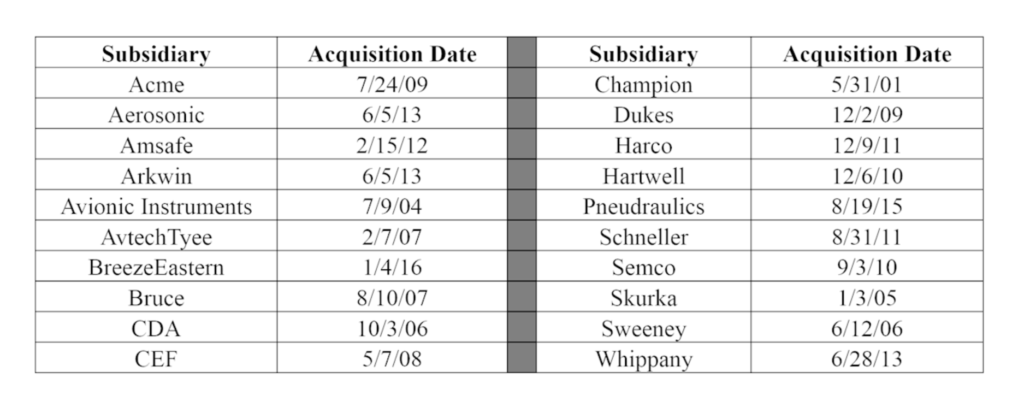
Data source and sample companies. We chose the following 20 Subsidiaries of TransDigm, which we believed would serve as a representative sample. Importantly, these companies retained their individual manufacturer CAGE code after acquisition, which facilitated tracking individual parts to create a clearer picture of the company’s before and after acquisition profile. We pulled the dates of acquisition directly from TransDigm’s SEC filings and press releases, using the closing date listed as the point of acquisition.
Through Haystack Gold, we created a batch search using each of the above manufacturers’ unique CAGE code. This allowed us to view and download pricing data for every procurement for every part that was manufactured by each of those companies that was available on Haystack Gold.
We then produced a dataset that included information on contracts associated with each of the above manufacturers including the part’s NIIN (National Item Identification Number), contract date, contract price, per-item price, and contract quantity. Sorting by each part’s unique NIIN and organizing by contract date, we were able to construct a history of the per-item price of every single part. We then spot checked and cross referenced a random sample of prices with procurement history provided by the DLA to ensure their accuracy.
Isolating behavior before and after acquisition. For each company, we eliminated all records for contracts that occurred four years prior to TransDigm’s acquisition of that company. Then, for each NIIN associated with a given acquired company, we ensured that we had at least three contracts:
• At least two contracts on two different dates on or before the acquisition date.
• At least one contract after the acquisition date.
Cutting the data down in this manner resulted in 2,156 data NIIN-company pairs. For each NIIN, we then pulled data for three contracts:
• Contract 1: The earliest pre-acquisition contract (subject to the four year constraint).
• Contract 2: The pre-acquisition contract closest to but before the acquisition date.
• Contract 3: The most recent post-acquisition contract.
Next, for each NIIN, we calculated a simple pre-acquisition price increase by comparing the per-unit price of Contract 2 to the per-unit price of Contract 1. Similarly, we calculated the simple post-acquisition price increase by comparing the per-unit price of Contract 3 to the per-unit price of Contract 2. For each of these figures, if the time difference between the two contracts was greater than one year, we converted the price increase to an annualized number. If the time difference was less than one year, we set the annualized price increase equal to the simple price increase.
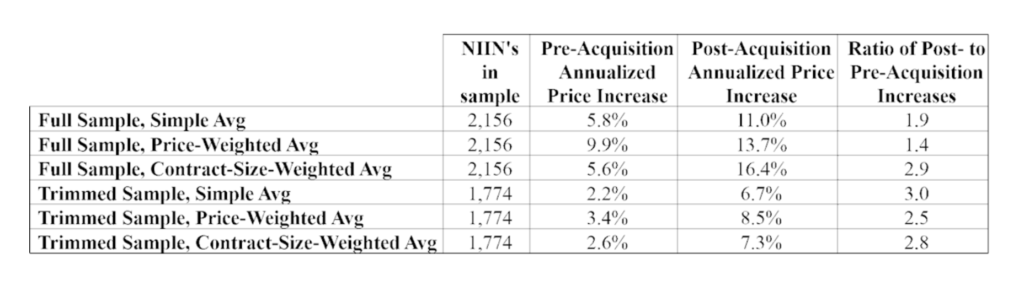
For our set of 2,156 NIINs, the simple average pre-acquisition annualized price increase was 5.8% while the average post-acquisition annualized price increase was 11.0%, or roughly 1.9 times as large.
Price-weighted and contract-sized-weighted averages. The figures represent a simple average, whereby all contracts are weighted equally (i.e. a contract for a $1.00 NIIN influences the simple average just as much as a $10,000 NIIN would). To gauge whether the size of the contract or the price of the part was related to the price increases enacted, we calculated price-weighted and contract-size-weighted averages for the pre- and post-acquisition annualized price increases. For these, each of the 2,156 pre- and post-acquisition figures was weighted first by the average unit price of the three contracts (for the price-weighted average) and second by the average contract value of the three contracts used (for the contract-size-weighted average).
Thus, in the price-weighted average, a contract for a part that cost, on average, $1,000, would receive 1,000 times the weight of a contract for a part that cost, on average, $1.00. And in the contract-size-weighted average, a contract for a part whose average contract value was $10,000 would receive 10 times the weight of a contract for a part whose average contract value was $1,000.
The price-weighted average annualized price increases were 9.9% and 13.7% for the pre- and post-acquisition periods, respectively. The contract-size-weighted figures were 5.6% and 16.4%, respectively.
Eliminating outliers. Finally, to test whether any extreme examples were skewing our results, we eliminated the NIIN’s that fell in the top or bottom 5% of the distribution of either the pre- or post-acquisition annualized price increase (or both). After doing so, we were left with 1,774 NIIN’s, and using this subsample, we performed the same analysis described above.
Not surprisingly, the absolute magnitude of price increases went down with the elimination of outliers, but the relationship between pre- and post-acquisition prices was more pronounced in general. The full results are again summarized in the following table.